Environmental Sensing
This experiment shows how LoRa™ can be used to monitor the quality of your surrounding environment.
Measure in- and outdoor air quality, noise levels and temperature to provide stakeholders a dashboard to support their decision making to improve quality of living.
The experiment
Prerequisites
For the prerequisites below, please check the quick start page!
- Have a LoRa™ device connected
- Arduino IDE installed
- SODAQ Mbili library installed
- AllThingsTalk library installed
Sketch implementation
We will measure our environment using 6 sensors. Every 5 minutes, all values will be read and sent to the AllThingsTalk Developer Cloud.
Schematic and ingredients
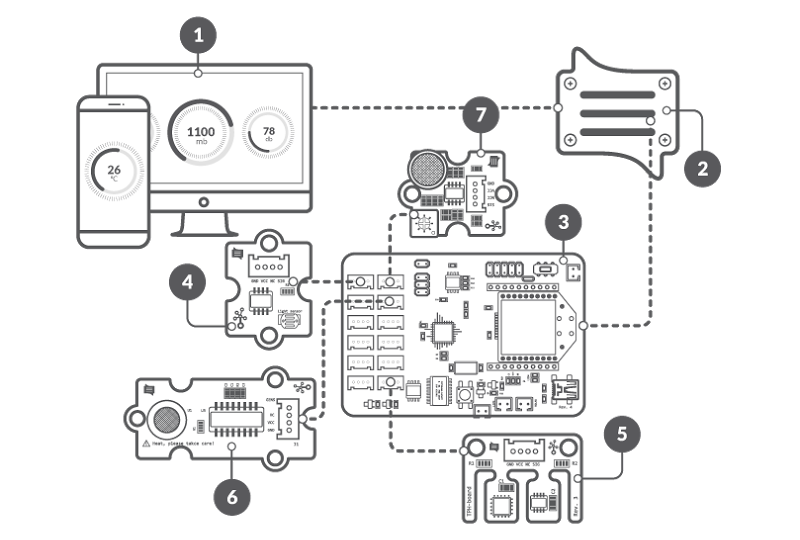
- SODAQ Mbili board with LoRa™ module
- Temperature, pressure, humidity sensor
- Air quality sensor
- Light sensor
- Sound level sensor
- AllThingsTalk Maker
Basic knowledge about how to work with a SODAQ Mbili is a must, if you’ve never used one before we suggest you take a look at the quick start page first!
Building Plan
- Collect hardware
- Attach LoRa™ module & antenna (without the range is very limited)
- Connect air quality sensor to A0/A1*
- Connect the light sensor to A2/A3*
- Connect noise sensor to A4/A5*
- Connect TPH sensor to SCL/SDA (I2C socket)*
- Connect SODAQ Mbili to your computer through USB
- Turn power switch ON
For more information on the Sodaq Mbili and connector pin numbers, please check this page.
Setup sketch
Now it’s time to upload the sketch to our device. Open the Arduino IDE.
- Under Tools > Board, select the SODAQ Mbili
- Open the
environmentalSensing.inofile from the/ATT_LoRa_IOT/examples/experiments/environmentalSensingfolder. This should open theenvironmentalSensing.inosketch as well as an emptykeys.hfile
1 | uint8_t DEV_ADDR[4] = {}; |
Next we will add our device keys to this keys.h file.
Add device keys
Get your device keys from AllThingsTalk
Add these keys to the keys.h file of your sketch.
These keys however are unique for your device, meaning the
keys.hfile will be the same for all projects. You can copy it to your harddisk once and copy it from there to your project folder each time.
Run the sketch
When your keys are set, it’s time to test.
- Upload and run the sketch
- After uploading, turn the power switch OFF and back ON
You can now watch the values change in AllThingsTalk Maker
Alternatively, you can open the Tools > Serial monitor of the Arduino IDE.
- Make sure you select the correct COM port to listen (under Tools > Port )
- When the monitor is open, make sure the Baud rate is set to 57600
Next steps
In total we have 6 assets, measuring our environment.
Some sensors output raw data values
| Sensor | Minimum | Maximum | Unit |
|---|---|---|---|
| Air quality | 0 | 1023 | |
| Light sensor | 0 | 1023 | |
| Loudness | 0 | 1023 |
The Temperature-Pressure-Humidity sensor outputs converted values
| Sensor | Minimum | Maximum | Unit |
|---|---|---|---|
| Temperature | -40 | 85 | °C |
| Pressure | 300 | 1100 | hPa |
| Humidity | 0 | 100 | RH |
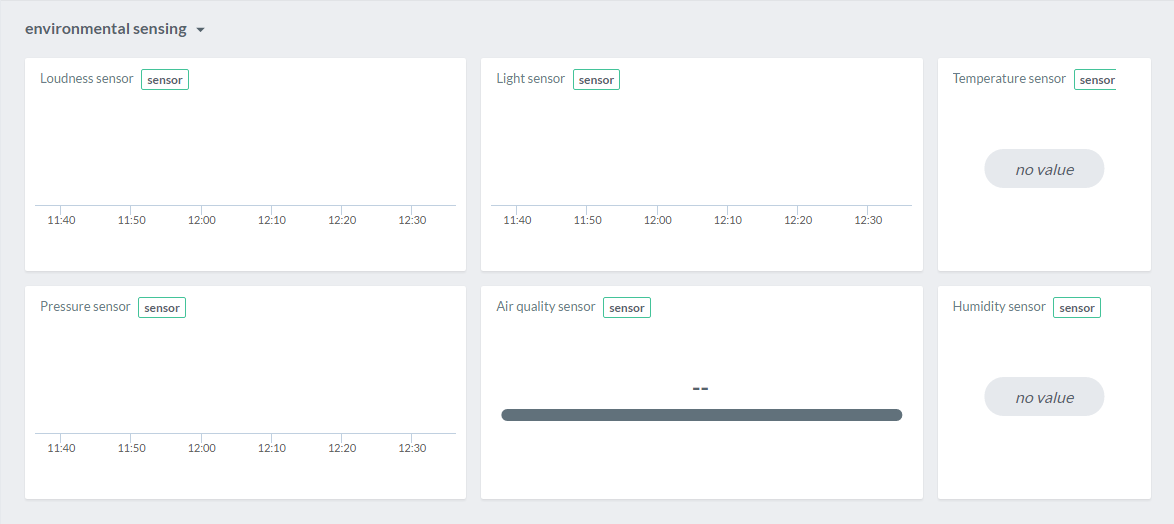
The profiles are already set correctly using the values and units from the table above. All we need to do is create a pinboard to visualise them.
Create pinboard
To visualise our date, we will create a pinboard. For more information on pinboards, please check how to use pinboards.
- Select the Pinboards icon in the top left
- Select the New pinboard icon
- Select the Arrange pinboard icon to enter the pinboard edit mode
Now we will pin a control (visual representation) for each of our assets (Loudness sensor, Light sensor, Temperature sensor, Humidity sensor, Pressure sensor and Air quality sensor).
- Select Pin control
- Select your LoRa device and one of the above mentioned assets
- Select an appropriate control for the selected asset. To visualise our data it is best to select either Historical Chart, Line progress or Label as control
- Click Pin control
Repeat this for each of our assets. For some extra options to customise your controls, please check the Controls page.